ELK & Grafana
2022年5月12日大约 5 分钟
ELK
随着排查问题越来越频繁以及有 ERROR 日志巡检的需要,需要搭建一套自己的 ELK 日志平台
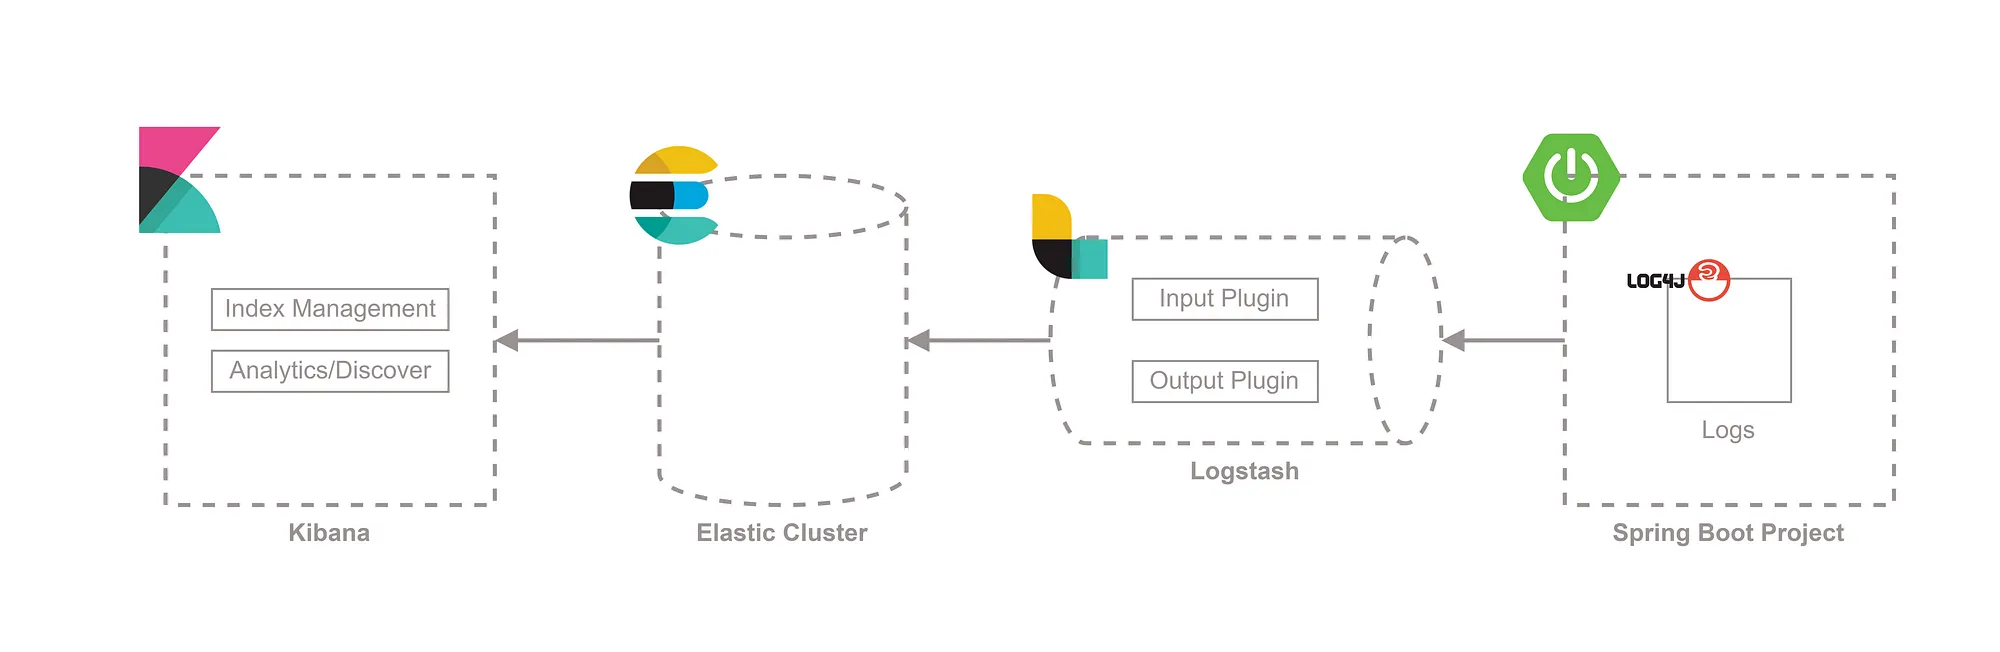
整体流程
SpringBoot
首先,我们要在 SpringBoot 中配置标准地日志格式,然后写入到相应地 log 文件中,以便 FileBeat 读取
- application.xml
logging:
config: classpath:logback-elk.xml- logback-elk.xml
<?xml version="1.0" encoding="UTF-8"?>

<configuration debug="false">

    <!--定义项目名称-->
    <springProperty scope="context" name="projectName" source="spring.application.name" defaultValue="csui"/>

    <!--日志文件存储路径-->
    <property name="LOG_HOME" value="logs"/>

    <!--日志输出格式-->
    <!--格式化输出:%d表示日期,%thread表示线程名,%-5level表示级别从左显示5个字符宽度,%logger表示类名,%method表示方法名,%line表示行号,%msg表示日志内容,%n表示换行符-->
    <property name="LOG_PATTERN"
              value="[%X{traceId}] %d{yyyy-MM-dd HH:mm:ss.SSS} [%thread] [%-5level] %logger{56}.%method:%line %msg%n"/>

    <!-- 控制台输出 -->
    <appender name="STDOUT" class="ch.qos.logback.core.ConsoleAppender">
        <encoder class="ch.qos.logback.classic.encoder.PatternLayoutEncoder">
            <pattern>${LOG_PATTERN}</pattern>
        </encoder>
    </appender>
    <!-- 文件输出,按照每天滚动生成文件 -->
    <appender name="FILE" class="ch.qos.logback.core.rolling.RollingFileAppender">
        <rollingPolicy class="ch.qos.logback.core.rolling.SizeAndTimeBasedRollingPolicy">
            <!--日志文件输出的文件名-->
            <FileNamePattern>${LOG_HOME}/${projectName}-%d{yyyy-MM-dd}-%i.log</FileNamePattern>
            <!--活动文件的大小-->
            <MaxHistory>30</MaxHistory>
            <maxFileSize>100MB</maxFileSize>
            <!--控制所有归档日志文件的总大小-->
            <totalSizeCap>1GB</totalSizeCap>
        </rollingPolicy>
        <encoder
                class="net.logstash.logback.encoder.LoggingEventCompositeJsonEncoder">
            <providers>
                <timestamp>
                    <timeZone>GMT+8</timeZone>
                </timestamp>
                <pattern>
                    <pattern>
                        {
                        "traceId": "[%X{traceId}]",
                        "dateTime": "%d{yyyy-MM-dd HH:mm:ss.SSS}",
                        "level": "%level",
                        "service": "${projectName}",
                        "thread": "%thread",
                        "class": "%logger.%method[%line]",
                        "message": "%message",
                        "stackTrace": "%exception"
                        }
                    </pattern>
                </pattern>
            </providers>
        </encoder>
    </appender>

    <!-- 日志输出级别 -->
    <root level="INFO">
        <appender-ref ref="STDOUT"/>
        <appender-ref ref="FILE"/>
    </root>

</configuration>
Beats
Beats 作为一个 agent,将自己的服务器数据上传到 es 或者 logStash
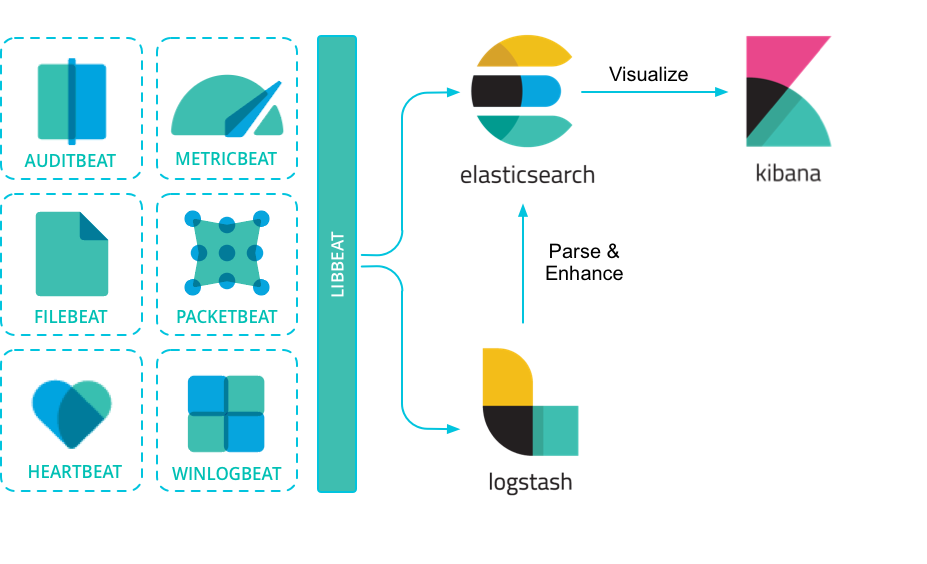
根据要上传的数据类型,细分成如下种类:
- Filebeat - 日志文件
- Auditbeat - 审计
- Heartbeat - 可用性
- Metricbeat - Metrics 打点
- Packetbeat - 流量
- Winlogbeat - Windows 事件
- Functionbeat - 云数据
我主要是用于日志收集,所以使用的 Filebeat,配置文件 filebeat.yml 中主要配置 filebeat.input(从哪里取日志)和 filebeat.output(发送到哪里)。其中 filebeat.output 可以配置 es,也可以配置 logstash
# ============================== Filebeat inputs ===============================

filebeat.inputs:

# Each - is an input. Most options can be set at the input level, so
# you can use different inputs for various configurations.
# Below are the input-specific configurations.

# filestream is an input for collecting log messages from files.
- type: filestream

  # Unique ID among all inputs, an ID is required.
  id: my-filestream-id

  # Change to true to enable this input configuration.
  enabled: false

  # Paths that should be crawled and fetched. Glob based paths.
  paths:
    - /var/log/*.log
    #- c:\programdata\elasticsearch\logs\*


# ================================== Outputs ===================================

# Configure what output to use when sending the data collected by the beat.

# ---------------------------- Elasticsearch Output ----------------------------
output.elasticsearch:
  # Array of hosts to connect to.
  hosts: ["localhost:9200"]

  # Performance preset - one of "balanced", "throughput", "scale",
  # "latency", or "custom".
  preset: balanced

  # Protocol - either `http` (default) or `https`.
  #protocol: "https"

  # Authentication credentials - either API key or username/password.
  #api_key: "id:api_key"
  #username: "elastic"
  #password: "changeme"

# ------------------------------ Logstash Output -------------------------------
#output.logstash:
  # The Logstash hosts
  hosts: ["localhost:5044"]

  # Optional SSL. By default is off.
  # List of root certificates for HTTPS server verifications
  #ssl.certificate_authorities: ["/etc/pki/root/ca.pem"]

  # Certificate for SSL client authentication
  #ssl.certificate: "/etc/pki/client/cert.pem"

  # Client Certificate Key
  #ssl.key: "/etc/pki/client/cert.key"
LogStash
Logstash 是一个轻量化的数据清洗工具,它可以接受多种类型数据源,并按照自己的要求格式化数据,最终输出到 ES 或者其他地方
核心配置
# Sample Logstash configuration for creating a simple
# Beats -> Logstash -> Elasticsearch pipeline.

input {
  beats {
    port => 5044
    codec => json
  }
}

filter {
    mutate {
        remove_field => ["log","input","@version","ecs","agent","original","event"]
    }
}

output {
    elasticsearch {
      hosts => ["http://localhost:9200"]
      index => "%{[@metadata][beat]}-%{[@metadata][version]}-%{+YYYY.MM.dd}"
    }
}- input:支持非常多的数据源,我这里用到地是 beats,也可以支持 http、jdbc、websocket 等多类协议
- filter:支持很多种数据处理地方法,比较常用地有 grok、mutate、json 等
- output:支持向多类数据源/中间件/协议输出数据,比如 es、kafka 等
ES
数据经过 filebeat->logStash 地收集清洗,接下来就是放到 es 存储,以便后续 kibana 读取展示
# ======================== Elasticsearch Configuration =========================
# ---------------------------------- Cluster -----------------------------------
#
# Use a descriptive name for your cluster:
#
cluster.name: my-application
#
# ------------------------------------ Node ------------------------------------
#
# Use a descriptive name for the node:
#
node.name: node-master
#
# Add custom attributes to the node:
#
#node.attr.rack: r1
#
# ----------------------------------- Paths ------------------------------------
#
# Path to directory where to store the data (separate multiple locations by comma):
#
path.data: /home/es/elasticsearch-8.11.3/data
#
# Path to log files:
#
path.logs: /home/es/elasticsearch-8.11.3/logs
#
# ----------------------------------- Memory -----------------------------------
#
# Lock the memory on startup:
#
#bootstrap.memory_lock: true
#
# Make sure that the heap size is set to about half the memory available
# on the system and that the owner of the process is allowed to use this
# limit.
#
# Elasticsearch performs poorly when the system is swapping the memory.
#
# ---------------------------------- Network -----------------------------------
#
# By default Elasticsearch is only accessible on localhost. Set a different
# address here to expose this node on the network:
#
network.host: 0.0.0.0
#
# By default Elasticsearch listens for HTTP traffic on the first free port it
# finds starting at 9200. Set a specific HTTP port here:
#
http.port: 9200
#
# For more information, consult the network module documentation.
#
# --------------------------------- Discovery ----------------------------------
#
# Pass an initial list of hosts to perform discovery when this node is started:
# The default list of hosts is ["127.0.0.1", "[::1]"]
#
#discovery.seed_hosts: ["host1", "host2"]
discovery.seed_hosts: ['0.0.0.0']
#
# Bootstrap the cluster using an initial set of master-eligible nodes:
#
cluster.initial_master_nodes: ['node-master']
#
# --------------------------------------------------------------------------------

# Enable security features
xpack.security.enabled: false

xpack.security.enrollment.enabled: true

# Enable encryption for HTTP API client connections, such as Kibana, Logstash, and Agents
xpack.security.http.ssl:
  enabled: true
  keystore.path: certs/http.p12

# Enable encryption and mutual authentication between cluster nodes
xpack.security.transport.ssl:
  enabled: true
  verification_mode: certificate
  keystore.path: certs/transport.p12
  truststore.path: certs/transport.p12
#----------------------- END SECURITY AUTO CONFIGURATION -------------------------
#
http.cors.enabled: true
http.cors.allow-origin: '*'- p12 证书生成方法
- 节点支持配置多个 es 机器(Discovery)
Kibana
可视化展示平台
这里核心配置就两个 Kibana Server(配置 kibana 端口 ip)和 ES hosts
# =================== System: Kibana Server ===================
# Kibana is served by a back end server. This setting specifies the port to use.
server.port: 5601

# Specifies the address to which the Kibana server will bind. IP addresses and host names are both valid values.
# The default is 'localhost', which usually means remote machines will not be able to connect.
# To allow connections from remote users, set this parameter to a non-loopback address.
server.host: '0.0.0.0'

# Enables you to specify a path to mount Kibana at if you are running behind a proxy.
# Use the `server.rewriteBasePath` setting to tell Kibana if it should remove the basePath
# from requests it receives, and to prevent a deprecation warning at startup.
# This setting cannot end in a slash.
#server.basePath: ""

# Specifies whether Kibana should rewrite requests that are prefixed with
# `server.basePath` or require that they are rewritten by your reverse proxy.
# Defaults to `false`.
#server.rewriteBasePath: false

# Specifies the public URL at which Kibana is available for end users. If
# `server.basePath` is configured this URL should end with the same basePath.
#server.publicBaseUrl: ""

# The maximum payload size in bytes for incoming server requests.
#server.maxPayload: 1048576

# The Kibana server's name. This is used for display purposes.
server.name: 'kibana'

# =================== System: Elasticsearch ===================
# The URLs of the Elasticsearch instances to use for all your queries.
elasticsearch.hosts: ['http://localhost:9200']
最终效果 & 使用场景
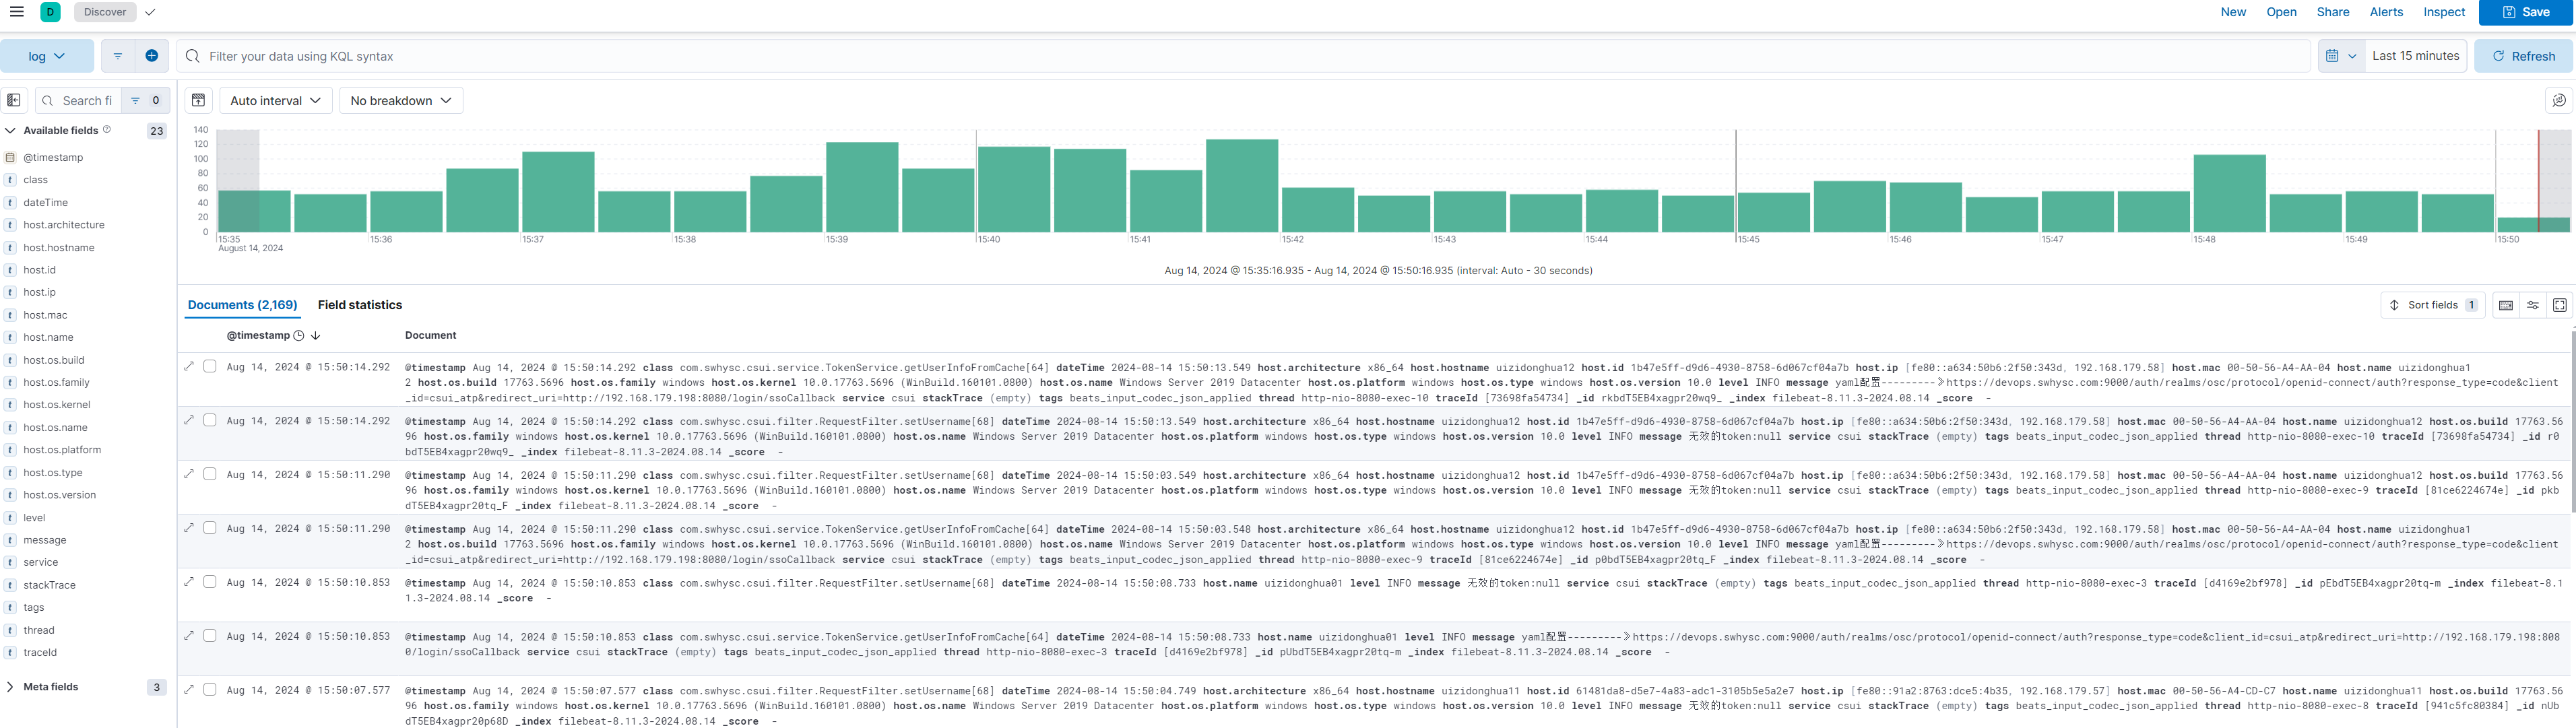
- 问题排查
- ERROR 日志聚合&巡检
- 上线观察